

When you leave your server a tip, do you round it to a whole-dollar amount and often in multiples of $5? Does a 60th birthday seem more significant than a 59th? If you answer yes to these questions, you’re not alone. Most of us prefer round numbers.
This preference leads many investors to review results by calendar year and to consider 10-year periods when evaluating long-term returns. People tend to place greater emphasis on the latest period due to recency bias and to extrapolate recent results into the future. For these reasons, we should put recent performance into the proper perspective.
During the most recent 10 years, equities delivered relatively strong performance amid volatility and uncertainty, with the MSCI All Country World IMI Index earning an annualized return of 8.49% through 2022. Within equities, higher-profitability stocks generally outperformed lower-profitability stocks globally and small caps outperformed large caps in regions outside the US, while the underperformance of value stocks garnered a lot of attention.1,2 Despite a strong rebound from late 2020 through 2022, the MSCI All Country World IMI Value Index underperformed the market, delivering an annualized 7.25% over the same 10-year period.3
While a positive premium is never guaranteed, the odds of realizing one are decidedly in your favor and improve the longer you stay invested.
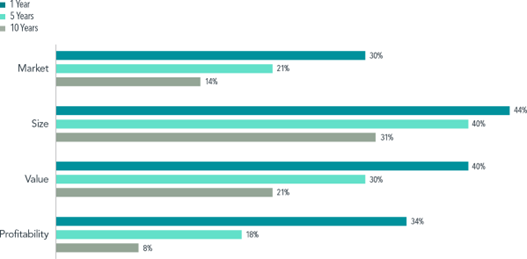
We expect positive market, size, value, and profitability premiums, but also recognize that realized premiums are volatile and can sometimes be negative. Although a negative premium can be disappointing, it is not unprecedented—and we can look at historical data to gauge how often each premium has been negative. For example, Exhibit 1 shows the frequency of experiencing a negative premium in the US over rolling one-, five-, and 10-year periods as far back as the data are available. As you can see, negative premiums occur from time to time. While a positive premium is never guaranteed, the odds of realizing one are decidedly in your favor and improve the longer you stay invested.
Exhibit 1: How Often Have Premiums Been Negative? Percentage of rolling one-, five-, and 10-year periods with negative premiums, US market through December 31, 2022
Past performance is not a guarantee of future results. Actual returns may be lower.
The Dimensional and Fama/French indices represent academic concepts that may be used in portfolio construction and are not available for direct investment or for use as a benchmark. Index returns are not representative of actual portfolios and do not reflect costs and fees associated with an actual investment.
Percentages of rolling one-, five-, and 10-year periods with negative premiums are calculated using monthly return data from June 1927 to December 2022 for market, size, and value, and from July 1963 to December 2022 for profitability. Market: The Fama/French Total US Market Research Index minus the One-Month US Treasury Bill. Size: The Dimensional US Small Cap Index minus the S&P 500 Index. Value: The Fama/French US Value Research Index minus the Fama/French US Growth Research Index. Profitability: The Fama/French US High Profitability Index minus the Fama/ French US Low Profitability Index. Profitability is measured as operating income before depreciation and amortization minus interest expense scaled by book. One-Month US Treasury Bills is the IA SBBI US 30 Day TBill TR USD provided by Ibbotson Associates via Morningstar Direct. Dimensional indices use CRSP and Compustat data. Fama/French indices are provided by Ken French. Dimensional and Fama/French index definitions are available in the Appendix. S&P data © 2023 S&P Dow Jones Indices LLC, a division of S&P Global.
This analysis looks at each premium individually. What if you integrate all four premiums in pursuit of higher expected returns? A different approach is to calculate the frequency that one, two, three, or all four of the premiums were negative over rolling 10-year periods from July 1963 to December 2022. As shown in Exhibit 2, in almost half of the rolling 10-year periods, we observe one negative premium out of four premiums. However, the premiums do not move in lockstep, so there were fewer instances of two negative premiums and no instances of three or four negative premiums.
Exhibit 2: One Negative Premium Is Not Uncommon – Number and percentage of rolling 10-year periods with negative premiums, US market, July 1963–December 2022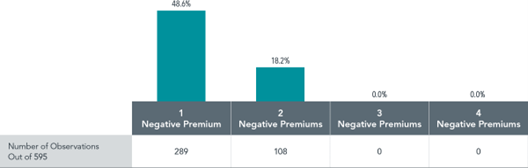
The number and percentage of rolling 10-year periods with one, two, three, and four negative premiums are calculated using monthly return data from July 1963 to December 2022. Indices are not available for direct investment; therefore, their performance does not reflect the expenses associated with the management of an actual portfolio. See Exhibit 1 for the definition of the premiums and data source.
In all likelihood, any premium that doesn’t materialize will get called into question. Plenty of ink will be spilled scrutinizing the one that had the bad draw, even if that’s all it was. The value premium has been under the microscope lately, but the other premiums have had their turns historically.
From an empirical perspective, a negative 10-year premium is not so far outside the range of outcomes as to suggest that the premium no longer exists. More importantly, we have a sensible framework for expecting positive size, value, and profitability premiums. That framework is valuation theory, which posits that a stock’s price reflects the company’s expected future cash flows discounted to present value. The discount rate equals an investor’s expected return. Therefore, as long as stocks have different expected returns, those with lower prices and higher expected cash flows should have higher expected returns. This framework holds regardless of whether realized premiums have been positive or negative in the recent past.
In Exhibit 3, we identify the rolling 10-year periods when a premium was negative and then examine how the premium behaved over the following 10 years. Our results confirm that premiums have, on average, been positive after periods of underperformance. While it is certainly disappointing to experience a negative 10-year premium, we believe that investors should avoid extrapolating the past into the next decade and abandoning their investment philosophy at potentially inopportune times.
Exhibit 3: Swing Back – Subsequent performance of 10-year premiums following a negative 10-year premium, US market through December 2022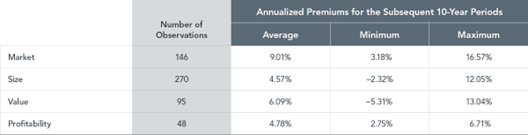
Annualized premiums are calculated over the subsequent 10-year periods following a negative 10-year market, size, value, or profitability premium using monthly return data from June 1927 to December 2022 for market, size, and value, and from July 1963 to December 2022 for profitability. The average, minimum, and maximum are calculated across all such 10-year periods for each premium. Excluded are 10-year periods that end after December 2022. Indices are not available for direct investment; therefore, their performance does not reflect the expenses associated with the management of an actual portfolio. See Exhibit 1 for the definition of the premiums and data source.
Over shorter horizons, the past performance of premiums doesn’t tell us much about future premiums either. For example, Exhibit 4 examines value’s performance from one calendar year to the next. Interestingly, the average annual value premium following the top quartile years—those with the strongest value performance—was roughly the same as the value premium in the year following the bottom quartile—or the weakest years for the value premium. So maintaining discipline and resisting the temptation to make changes based on short-term performance can be beneficial. If your goals and risk tolerance haven’t changed, then your asset allocation likely doesn’t need to change.
Exhibit 4: Does Value Last Year Tell Us About This Year? Annual value premiums and subsequent-year value premiums, US market, 1927-2022
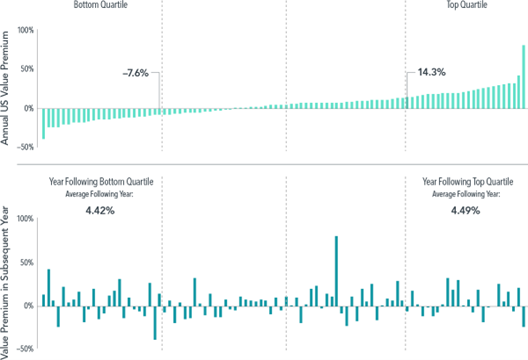
The annual value premium is the return difference between the Fama/French US Value Research Index and the Fama/ French US Growth Research Index. The Fama/French indices represent academic concepts that may be used in portfolio construction and are not available for direct investment or for use as a benchmark. Index returns are not representative of actual portfolios and do not reflect costs and fees associated with an actual investment. Source: CRSP and Compustat data calculated by Dimensional. Fama/French data is provided by Fama/French. Eugene Fama and Ken French are members of the Board of Directors of the general partner of, and provide consulting services to, Dimensional Fund Advisors LP. Fama/ French index definitions are available in the Appendix.
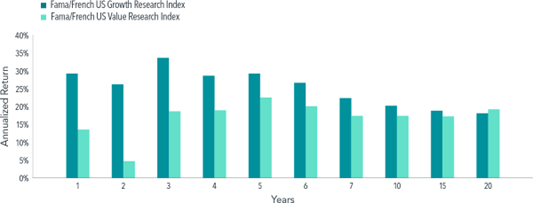
Furthermore, premiums can materialize quickly, so you want to be properly positioned to capture the returns when they show up. The period leading up to and shortly after the start of the 21st century provides an extreme, albeit anecdotal, example. Exhibit 5 Panel A shows the performance of the Fama/French US Growth and US Value Research indices. Growth beat value over most trailing periods from one to 20 years ending March 31, 2000. Consequently, many investors found themselves questioning a value strategy, meaning they wondered whether expected returns were still related to the price paid for a stock in the so-called “new economy.”
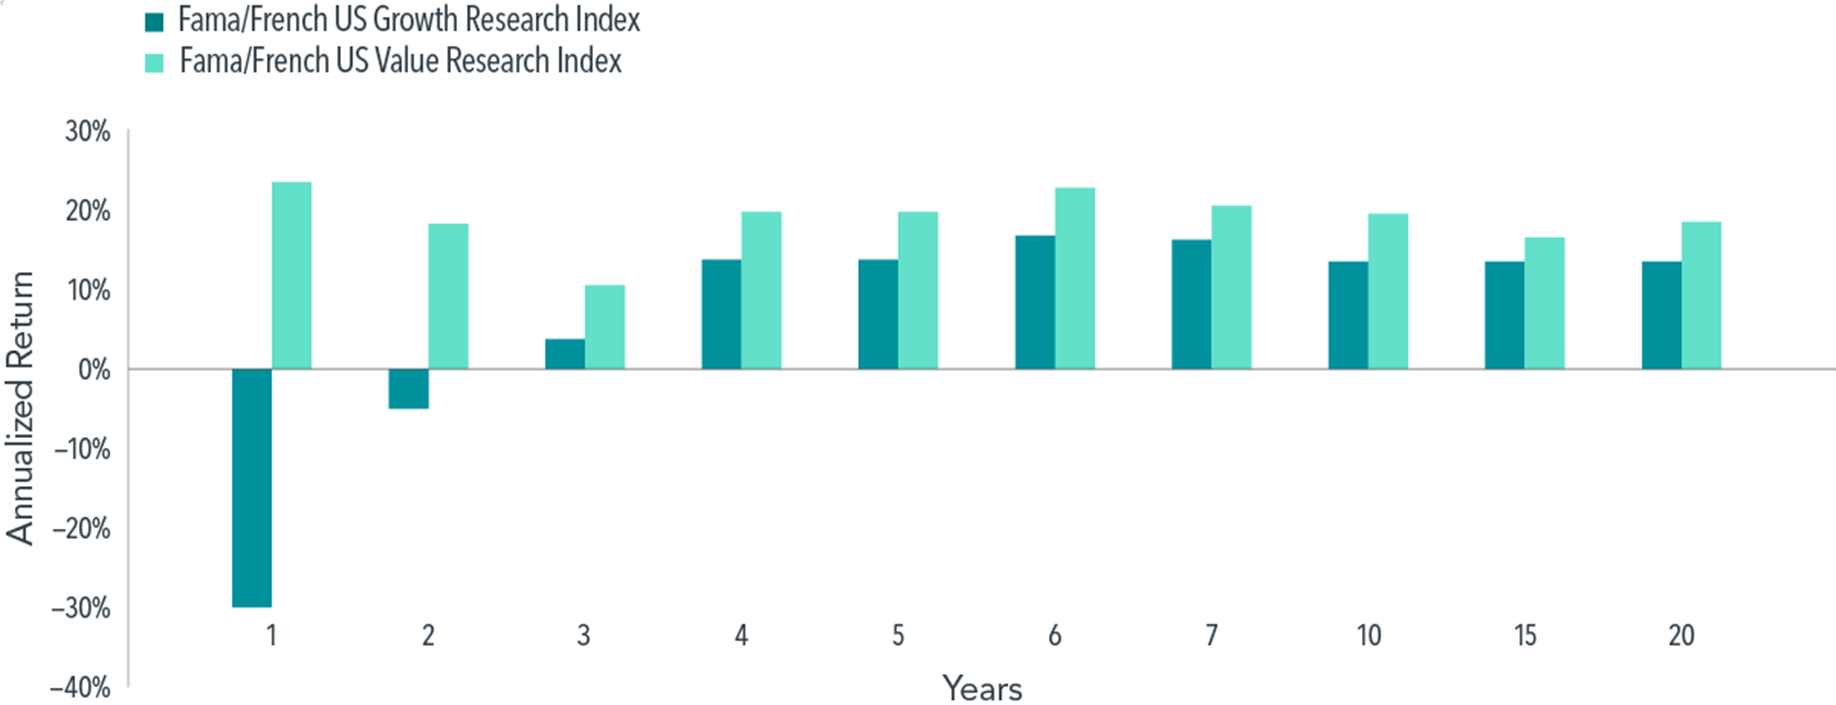
Investors who capitulated to this line of reasoning may have regretted their decision a mere 12 months later, because the value index strongly outperformed the growth index, as illustrated in Exhibit 5 Panel B, over every trailing period from one to 20 years ending March 31, 2001. The moral of the story? Negative outcomes are disappointing, but investors should view them with the proper perspective and stay the course.
Exhibit 5: Premiums Can Materialize Quickly
Panel A: Trailing periods ending March 31, 2000
Panel B: Trailing periods ending March 31, 2001
The Fama/French indices represent academic concepts that may be used in portfolio construction and are not available for direct investment or for use as a benchmark. Index returns are not representative of actual portfolios and do not reflect costs and fees associated with an actual investment. Source: CRSP and Compustat data calculated by Dimensional. Fama/ French data is provided by Fama/French. Eugene Fama and Ken French are members of the Board of Directors of the general partner of, and provide consulting services to, Dimensional Fund Advisors LP. Fama/French index definitions are available in the Appendix.
DISCLOSURES
The information in this document is provided in good faith without any warranty and is intended for the recipient’s background information only. “Dimensional” refers to the Dimensional separate but affiliated entities generally, rather than to one particular entity. Please click here to read the full text of the Dimensional Fund Advisor Disclaimer.