Aggregate stock market valuation ratios have not been strong predictors of broad market returns. And yet, high stock valuations sit near the top of concerns cited by investors about the state of equity markets. However, this perception stems from a subset of stocks, and investors should be careful not to throw the baby out with the bathwater by ascribing this characteristic to the global stock market.
A Note on Risk
It’s important to remember that all investments carry risks. The value of an investment and any income it generates can fluctuate, meaning investors may end up with more or less than their original investment when they redeem. Past performance does not guarantee future returns, and there is no certainty that any strategy will be successful.
Take, for example, the so-called “Magnificent Seven”—Alphabet, Amazon, Apple, Meta, Microsoft, Nvidia, and Tesla. As of September 30, these giants had an aggregate price-to-book (P/B) ratio of 11.89, despite six out of the seven posting lower profitability than the S&P 500 index. For context, the average P/B ratio for the US market over the past 30 years is just 3.05. The lofty valuations of these tech leaders have helped push the P/B ratio of the tech-heavy Nasdaq Composite to 5.21.
Yet, zooming out reveals a different picture. Broader market indices, particularly those including non-US stocks, are trading at much more modest valuations. For instance, the global MSCI All Country World IMI Index currently has a P/B ratio less than half that of the Nasdaq, underscoring the importance of not letting a handful of high-profile companies distort our view of the market as a whole.
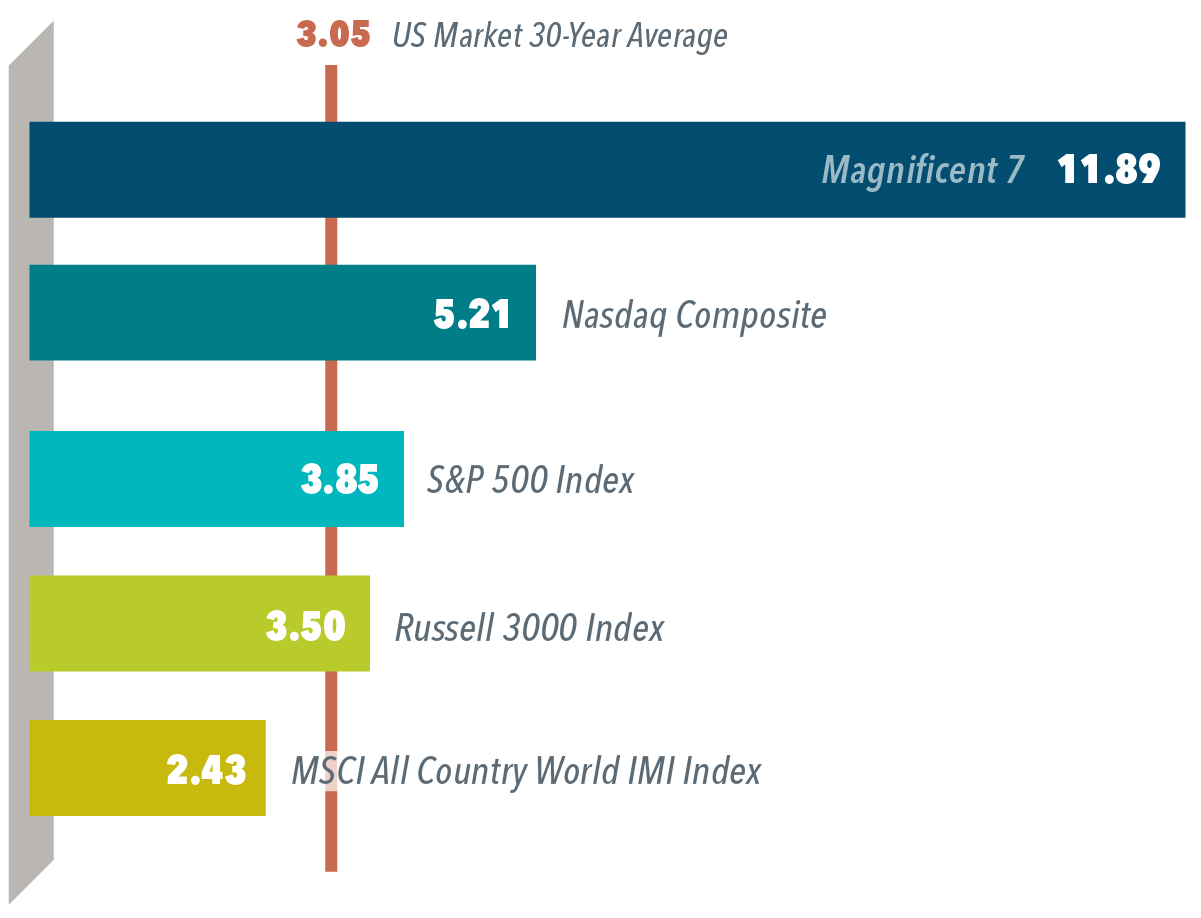
The poster child for high valuations—the so-called Magnificent Seven (Alphabet, Amazon, Apple, Meta, Microsoft, Nvidia, and Tesla)—had an aggregate price-to-book (P/B) ratio of 11.89 as of September 30 (despite six of the seven having lower profitability than the S&P 500 index). To put that in perspective, the average for the US market over the past 30 years is 3.05.1
These stocks helped push up the P/B ratio of the tech-heavy Nasdaq Composite to 5.21.
But broader market indices, especially those with non-US stocks, have substantially lower
valuations. For example, the global MSCI All Country World IMI Index P/B is less than
half that of the Nasdaq.
Understanding the Limits of Index Investing
It’s important to note that market indices themselves aren’t investment products—think of them more as scoreboards than actual teams you can join. While indices like the S&P 500, MSCI, and Russell serve as useful benchmarks for comparing returns and evaluating market performance, you can’t invest in the index directly. Instead, investors access the returns of these benchmarks through mutual funds or ETFs that aim to replicate their composition.
Additionally, each of these indices is governed by unique methodologies for selecting and weighing stocks, which can influence the returns and risks of investments that track them. So, while indices are invaluable as reference points, their use comes with limitations when making real-world investment decisions.
Exhibit 1
Shopping Around
Aggregate price-to-book ratios as of September 30, 2023
Indices are not available for direct investment. S&P data © 2023 S&P Dow Jones Indices LLC, a division of S&P Global. All rights reserved. Frank Russell Company is the source and owner of the trademarks, service marks, and copyrights related to the Russell Indexes. MSCI data © 2023, all rights reserved.
FOOTNOTE
1. Average P/B ratio for the Fama/French Total US Market Research Index from October 1998 through September 2023.
DISCLOSURES
The information in this document is provided in good faith without any warranty and is intended for the recipient’s background information only. “Dimensional” refers to the Dimensional separate but affiliated entities generally, rather than to one particular entity. Please click here to read the full text of the Dimensional Fund Advisor Disclaimer.