Investment Resource: The S&P 500® rose by 16.9% in the first six months of 2023, marking a sharp rebound from its decline of 18.1% in 2022. The rally extended to smaller stocks, although less emphatically, as the S&P MidCap 400® increased 8.8% and the S&P SmallCap 600® returned 6.0%. Fixed income markets also gained ground, despite the uncertain course of inflation, continued Fed tightening, an inverted yield curve, and ructions connected to the demise of several regional banks.
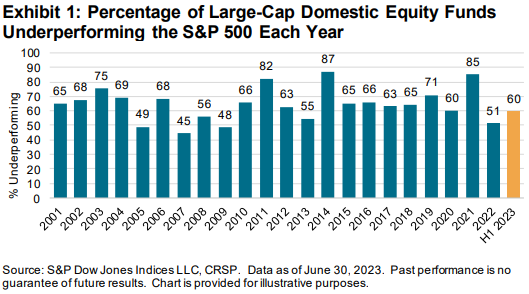
Although active managers in a number of categories were able to outpace their benchmarks in the first six months of the year, in our largest and most closely watched comparison, 60% of all active large-cap U.S. equity managers underperformed the S&P 500. As Exhibit 1 illustrates, a majority of large-cap managers outperformed in only 3 of the last 23 years (missing by a whisker in 2022). But active underperformance is not a coincidence, and, as we will discuss, some of the factors that made it close last year worked in the opposite direction in the first six months of 2023.

For smaller-capitalization U.S. equity managers, first-half results were more promising. Only 48% of mid-cap managers lagged the S&P MidCap 400, while a creditable 28% of small-cap managers underperformed the S&P SmallCap 600. What was particularly striking about our U.S. equity results was the divergent performance of growth and value specialists. Only 13% of large-cap growth managers underperformed the S&P 500 Growth index, with similar success rates among their mid- and small-cap counterparts. Meanwhile, 90% of large-cap value managers lagged the S&P 500 Value index; most mid- and small-cap value specialists also underperformed, although by smaller margins.
Funds incorporating non-U.S. stocks produced mixed results: slight outperformance among larger-cap international managers and modest underperformance among smaller caps, with generally good results for emerging markets and disappointing performance for global funds. Fixed income results were likewise mixed. The bright spots for active fixed income came in the municipal and some investment grade categories. Most government funds lagged their benchmarks, as did 100% of Core Plus Bond funds and 89% of funds in the General Investment-Grade category.
As we’ve noted in previous reports, underperformance rates typically rise as time horizons lengthen. Exhibit 2 illustrates the point. In the first six months of 2023, 10 of the 39 categories in this report saw more than 75% of managers underperform their benchmark. Over a five-year horizon, 24 categories saw this level of underperformance, and after 15 years, the tally rose to 32 categories. Meanwhile, after 15 years, there were no categories in which the majority of active managers outperformed.

To read the full article, check out the file here.
Article Source: https://www.spglobal.com/spdji/en/spiva/article/spiva-us

