

Many retirement investors hold equity portfolios that track broad market indices, either directly or through other investments such as target date funds. Despite their widespread popularity, market portfolios may leave money on the table. Core equity portfolios—low-cost, broadly diversified equity portfolios with a moderate emphasis on the size, value, and profitability premiums—can provide higher expected returns while controlling the risk of underperformance relative to the market.
In new Dimensional research, we examine the benefits of core equity investing for retirement outcomes. The potential benefits can start building up in the accumulation phase. Consider two investors who contribute to a retirement account from age 25 to 65 and follow a conventional target date glide path, in which assets are heavily invested in equities at younger ages and converge to a 50/50 mix of stocks and bonds by age 65. The equity portion is invested either in a core portfolio or the broad market without any emphasis on the premiums. Our results, summarized below, show that an investor in the core portfolio will typically reach 65 with 15%–20% more assets than an investor in the plain market portfolio.
EXHIBIT 1
Premium Rewards – Distribution of assets at the beginning of retirement as a function of premium exposure in the equity sleeve. 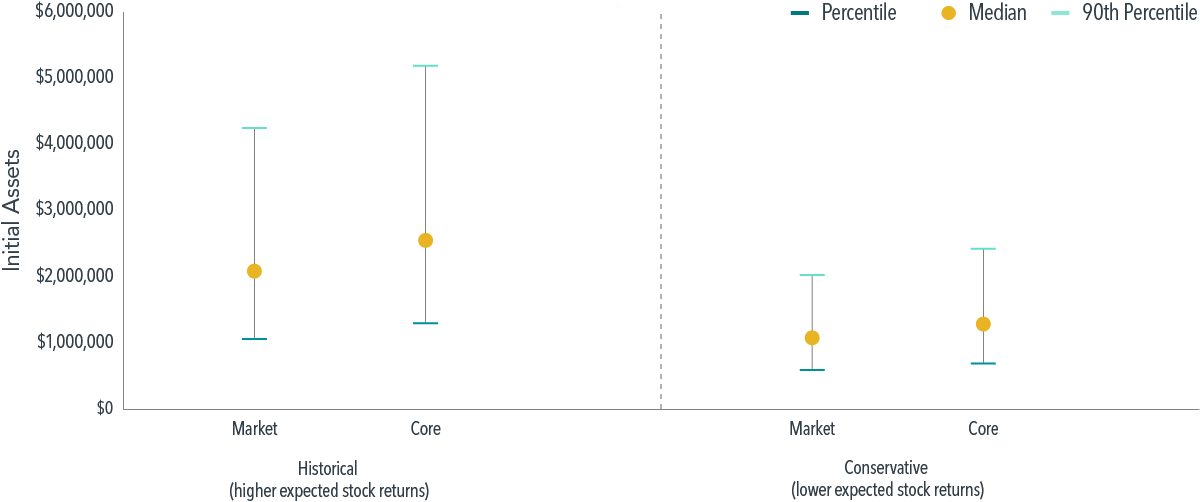
The observed benefits of core equity investing continue into retirement. Going back to our example, let’s assume that both investors retire with a 50/50 split of stocks and bonds and spend a fixed amount every year. If future stock returns look like past returns, the probability of failure with either portfolio is low (see Exhibit 2), but the core portfolio still does better—and, as we show in the paper, also results in a higher average bequest. If future stock returns are lower than in the past, failure rates increase across the board, but so does the potential benefit of core equity, which reduces the average failure rate from 20% to 13%. Here, too, the cost of tracking a market index appears steep; the chance of running out of assets early jumps by 7 percentage points—nearly 54%.
EXHIBIT 2
Premium Rewards – Failure rates depending on premium exposure in the equity sleeve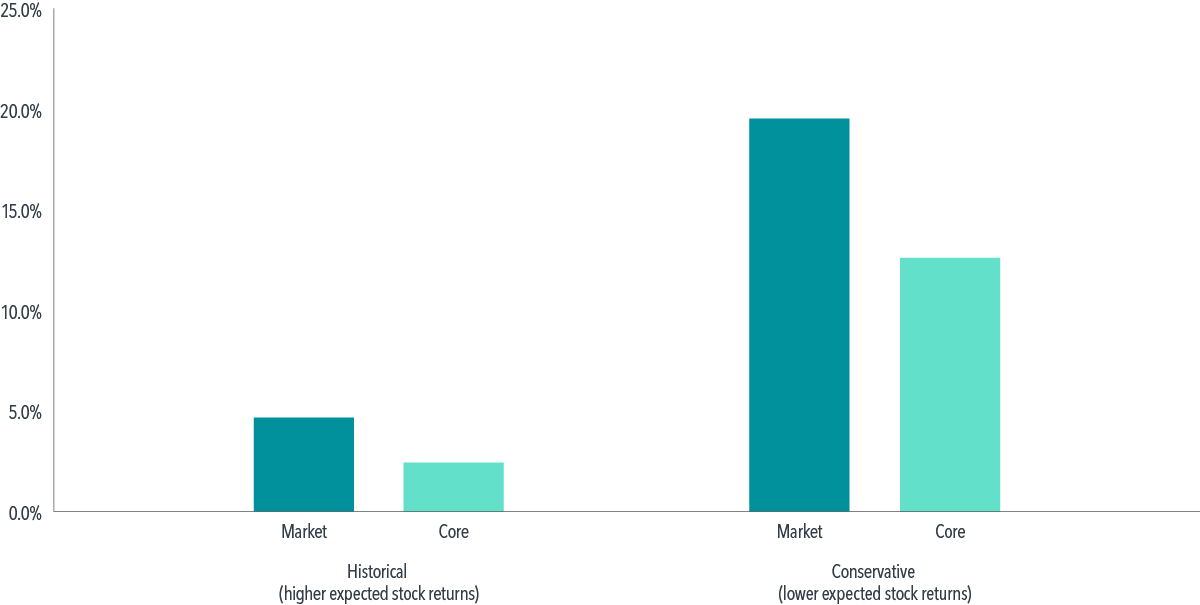
Of course, these benefits come at the cost of tracking error relative to the market, something that market indexing avoids by definition. However, our results show that, when it comes to avoiding tracking error, the cure may be worse than the disease. The study finds that market indexing results in initial retirement assets that are 15% lower on average relative to the core approach. Would you give up an expected 15% of your retirement assets to avoid all tracking error?
Retirement investing involves long investment horizons, which help improve the reliability of capturing the premiums and magnify the effect of higher expected returns. This makes core equity investing an attractive, practical alternative to market indexing—one that can put retirement investors in a stronger position to reach their goals.
This paper can also be found on SSRN.
GLOSSARY
4% spending rule: The 4% rule was developed by William Bengen in the mid-1990s as a rule of thumb designed to help investors choose how much they want to spend annually in retirement.
Accumulation phase: In the context of retirement investing, the accumulation phase covers all preretirement years.
Bootstrapping: In the context of the results above, bootstrapping consists of drawing random subsamples from the historical return sample and computing a quantity of interest (e.g., assets at the beginning of retirement) on the subsamples.
Expected return: Expected payoff of a security (price appreciation + interest/dividend payments) over a given period, divided by the current market price.
Market indexing: Refers to index funds that track a broad market index like the Russell 3000 or the MSCI ACWI.
Size, value, and profitability premiums: The size premium refers to the tendency of stocks from issuers with a small market capitalization to overperform those of issuers with a large market capitalization. The value premium refers to the tendency of stocks with low relative prices (stock price divided by an accounting metric such as book value) to outperform. The profitability premium refers to the tendency of stocks of issuers with high relative operating profits (operating profits divided by an accounting metric such as book equity) to outperform.
Tracking error: The standard deviation of the difference in returns between two portfolios, one of which is typically a benchmark. Essentially, tracking error provides a measure of how much a portfolio deviates from its benchmark.
METHODOLOGY APPENDIX
We consider a hypothetical investor who retires at age 65 and spends until age 95 according to a 4% spending rule. Retirement spending is 4% of the initial balance at retirement. Spending remains constant in inflation-adjusted terms through retirement. The investor withdraws the spending amount at the beginning of each month. The balance then evolves according to portfolio returns. If the balance hits zero, we treat this as a failure.
All the returns used in the simulations are inflation-adjusted using the US consumer price index (CPI).
Portfolio returns are based on a constant, 50/50 split between stocks and bonds. The market portfolio is proxied by the CRSP Deciles 1–10 Index, while the core portfolio is proxied by Dimensional US Adjusted Market 1 Index. Five-year Treasury notes proxy for bond performance. The sample period runs from June 1927 to December 2022.
For each simulated retirement, we draw 30-year (360-month) return histories from our sample. We use block bootstrap with a mean block size of 10 years (120 months) to sample inflation-adjusted annual returns.
We bootstrap returns from the historical distribution and a conservative distribution. The conservative distribution is obtained by subtracting 1.65 times the standard error (1.65 x 1.89% = 3.1%) of the average stock return from the historical average (8.1%). This is equivalent to assuming that the long-run inflation-adjusted equity return is 5.0%, which corresponds to the fifth percentile of the estimated distribution of the average historical return.
Average real historical returns were obtained by dividing CRSP Deciles 1–10 Index returns by monthly inflation according to the formula (1+ CRSP Deciles 1–10 Index return)/(1+CPI growth) – 1. Real monthly returns are then averaged and multiplied by 12 to annualize them.
The projections or other information generated by bootstrapped samples regarding the likelihood of various investment outcomes are hypothetical in nature, do not reflect actual investment results, and are not guarantees of future results. Results will vary with each use and over time.
DISCLOSURES
The information in this document is provided in good faith without any warranty and is intended for the recipient’s background information only. “Dimensional” refers to the Dimensional separate but affiliated entities generally, rather than to one particular entity. Please click here to read the full text of the Dimensional Fund Advisor Disclaimer.