
What Really Drives Higher Expected Returns? Principle 5 in Evidence-Based Investing

There is a wealth of academic research into what really drives higher expected returns. Simply put, expected returns = current market prices + expected future cash flows. Investors can use this basic equation to optimize their portfolios accordingly.
The Evidence on Higher Expected Returns

In our last post, we described how to build lifetime wealth by patiently benefiting from the market factors that contribute the most to higher expected returns. So, what are those factors, and how did we identify them to begin with?
Since at least the 1950s, a “Who’s Who” body of scholars has been studying portfolio management to answer key questions, like:
- What factors drive expected market returns? Which factors have persisted over time, around the world, and through various markets? Once we’ve identified a potential factor, are there reasons it’s likely to persist moving forward?
- What drives portfolio performance (alpha vs. beta)? When comparing portfolios, what best explains their different performances? Does the biggest difference come from different exposures to overall return factors? In financial parlance, that’s a portfolio’s beta. Or is it the portfolio manager’s stock-picking or market-timing skills? That’s value-added alpha.
A Brief History of Factor Investing
In 1992, professors Eugene Fama and Kenneth French published their landmark paper, “The Cross-Section of Expected Stock Returns,” in The Journal of Finance. The paper led to the Fama-French three-factor model, which laid the groundwork for factor-based investing. (It also earned Fama a Nobel Prize in Economics in 2013.)
The three-factor model built on an earlier, single-factor Capital Asset Pricing Model (CAPM). While CAPM found market beta alone could explain around 70% of the differences, the three-factor model, with three sources of beta, offered over 90% explanatory power.
In 2014, Fama-French published “A five-factor asset pricing model” in the Journal of Financial Economics. They then stress-tested these same five factors in international markets and published the results in a 2017 paper in the same publication.
In short, over time, the academic community has continued to study new and existing factors. How do they interact with one another? How do they contribute to beta-generating returns? The more we understand about factor investing, the harder it is to believe investors can add consistent value by chasing extra, alpha-generated returns. At least not beyond what already is available through a low-cost, well-structured, evidence-based portfolio.
Or, as Fama has explained more simply:
“Pick your risk exposure, and then diversify the hell out of it.”
Factors That Figure into Higher Expected Returns

Grounding your investment strategy in rational methodology strengthens your ability to stay on course toward your financial goals, as we:
- Assess existing factors’ ability to offer higher expected returns and diversification benefits
- Understand why such factors exist, so we can most effectively apply them
- Explore additional factors that may complement our structured approach
Assessing the evidence (so far)
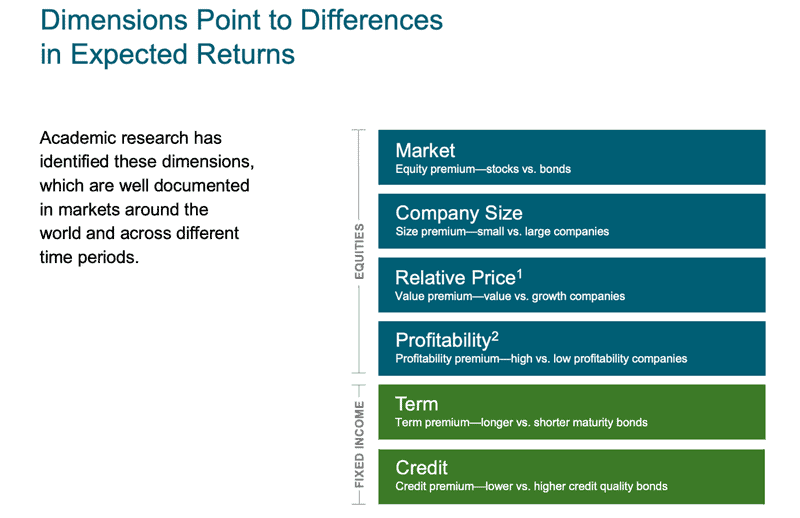
Studies dating back to the 1950s have identified three stock market factors that have formed the backbone for evidence-based portfolio construction. Over the long-run, investors can pursue higher expected returns by tilting their portfolio toward:
1. The equity premium: Stocks (equities) have returned more than bonds (fixed income).
2. The small-cap premium: Small-company stocks have returned more than large-company stocks. (Although recent analysis suggests this factor may require additional dissection to isolate its essential premium.)
3. The value premium: Value companies have returned more than growth companies (Value companies exhibit lower ratios between their stock price and various business metrics such as company earnings, sales, and/or cash flow. Growth companies exhibit higher such ratios.) Based on these metrics, value stocks appear to be either undervalued or more fairly valued by the market, compared with their growth stock counterparts.
This is the trio of stock market factors described in Fama-French’s three-factor model. Similarly, studies have identified two primary factors driving long-term higher expected returns for fixed income (bond) investments:
1. Term premium: Bonds with distant maturities or due dates have returned more than bonds that come due quickly.
2. Credit premium: Bonds with lower credit ratings (such as “junk” bonds) have returned more than bonds with higher credit ratings (such as U.S. treasury bonds).
Additional evidence from the “Factor Factory”
With the factors above identified, does this mean we know everything about how to build “perfect” portfolios? Hardly! Continued inquiry has found additional market factors at play, with additional potential premiums. For example, the five-factor model Fama/French examined includes equity, small-cap, and value, plus potential premiums from profitability and momentum:
- Profitability: Highly profitable companies have delivered premium returns over low-profitability companies.
- Momentum: Stocks that have done well or poorly recently tend to continue to do the same for longer than random chance seems to explain.
While these “new” factors may have existed for some time, our ability to isolate them is more recent. As a result, opinions vary on when, how, or if profitability, momentum, and hundreds of other potential factors contribute to higher expected returns.
If there are hundreds of factors to consider as potential sources of higher expected returns, how do we know which ones to heed, and which may be best ignored? Whenever we assess the validity of new and existing market insights, we ask pointed questions that can take years to resolve:
- Have we replicated the studies across factors, over time and around the world?
- Is there robust analysis, not only from industry insiders but also from objective academics?
- Has a proposed new factor survived extensive peer review, if not unscathed, at least free of mortal wounds?
If we can say “yes” to these three queries, we figure we’re heading in the right direction. As Fama explains, “There’s one robust new idea in finance that has investment implications maybe every 10 or 15 years, but there’s a marketing idea every week.”
Where Do Higher Expected Returns Come From?
Before we wrap, let’s touch on one more important point: Scholars and practitioners alike strive to determine not only that various return factors exist, but why they exist. This helps us assess whether a factor is likely to persist and continue contributing to higher expected returns, or whether it’s more likely to disappear upon discovery.
Explanations for why factors persist (or not) usually fall into two broad categories: risk-related and/or behavioral.
A tale of risks and expected rewards
Persistent premium returns are often explained by accepting market-related risks in exchange for expected reward. As we described in “How Markets Work for You,” these are the types of “worst than expected” risks that are almost instantly incorporated into pricing in largely efficient markets. Academics have identified some factors persistently experience more of these types of risks than others, so investors expect a premium return for investing in them.
For example, it’s presumed that value stocks are riskier than growth stocks. In “Value Premium Lives!” financial author Larry Swedroe explains:
“Among the risk-based explanations for the premium are that value stocks contain a distress (default) factor, have more irreversible capital, have higher volatility of earnings and dividends, are much riskier than growth stocks in bad economic times, have higher uncertainty of cash flow, and … are more sensitive to bad economic news.”
A tale of behavioral instincts
There may also be behavioral foibles at play. That is, our basic-survival instincts often play against otherwise well-reasoned financial decisions. As such, the market may favor those who are better at overcoming their gut reactions to breaking news.
Your Take-Home
The pursuit of higher expected returns may require taking on added risk, avoiding the self-inflicted wounds of behavioral temptations, or both. Regardless, existing and unfolding inquiry on market return factors continues to hone our strategies for most effectively capturing expected returns according to your personal goals.
By considering each new potential factor according to strict guidelines, our aim is to extract the diamonds of promising new evidence-based insights from the considerably larger piles of misleading misinformation. We feel you are best served by heeding those who take a similar approach with their advice.
To see all 10 principles of Evidence-Based Investing at a glance, please visit our Evidence-Based Principles Guide. These principles inform our investing process.
About the Author Doug Finley
Douglas Finley, MS, CFP, AEP, CDFA founded Finley Wealth Advisors in February of 2006, as a Fiduciary Fee-Only Registered Investment Advisor, with the goal of creating a firm that eliminated the conflicts of interest inherent in the financial planner – advisor/client relationship. The firm specializes in wealth management for the middle-class millionaire.
Related Posts
Financial Goals: Your Tickets To Ride
Looking for the Next Nvidia May Shrink Your Return
What’s Baked into Your Credit Exposure?
Top 500 Stocks, Give or Take $2.1 Trillion
Japan in the News, But It’s Nothing New
Curve Your Enthusiasm with Fed Activity
Bringing Order to Your Investment Universe Part 2: Transitions and Taxes
Bringing Order to Your Investment Universe Part 1: The Beauty of Being Organized
Session expired
Please log in again. The login page will open in a new tab. After logging in you can close it and return to this page.