
The Stock Market Can Be Less Risky Than Cash

Common sense will sometimes cost you a lot of money. Comparing inflation-adjusted returns shows when investing in the stock market was less risky than cash.
Do You Own any Stocks?
A Gallup poll shows that following the so-called “Great Recession,” fewer Americans invest in the stock market, dropping on average from 62% in 2001–2008, to 54% in 2009–2017. The decline was greatest among younger Americans, who have the longest time horizon to make up for any stock market losses.
If you owned stock during the “Great Recession,” you may well have concluded that owning stocks is hazardous for your financial health. However, if you look in the long term, nothing could be further from the truth, and if you hold only cash, you may as well burn (much of) your money!
What Does the Data Say about the Risk of Investing in the Stock Market?
Considered by many as the “father of value investing,” Benjamin Graham said, “In the short run, the stock market is a voting machine but in the long run, it is a weighing machine.” In other words, in the short term, you have to guess which stocks will go up, or at least if the market as a whole will. However, in the long term, the economy tends to grow, so on average, the stock market will go up.
Looking at the annual returns of the S&P 500 index (with dividends reinvested) from 1926 to 2018, we see that the market lost money in just a bit more than a quarter of those years. As you increase the time period length, the fraction of losing periods drops to about 1 in 8 for 5 years, 1 in 20 for 10 years, and none at all for rolling 20-year periods.
Stock market losses are less frequent for longer investment periods
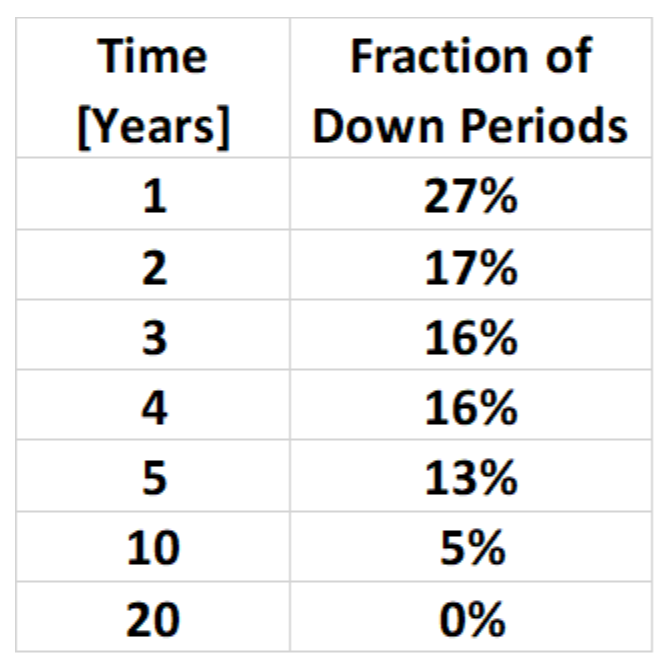
Fraction of rolling periods with market losses between 1926 and 2018
If you’re planning to spend the money right after the period in question, you’d be justified in considering the maximum loss possible too. In that regard, the worst one-year loss was 43%, and the worst-case total loss increases as you look at longer periods until you start dropping from 4-year periods to 5- and 10-year periods. For 20-year periods, the worst-case total was actually a gain of 84%!
Looking at annualized returns, each time you look at a longer period, the worst case becomes better, and the best case becomes worse. Whereas the difference for a single year is 97% (between 54% gain and 43% loss), for 5-year periods that range drops to 41%. For 20-year periods, the best-to-worst range narrows to 15%.
Over longer periods, the best- and worst-case stock market performance gets closer to the average performance
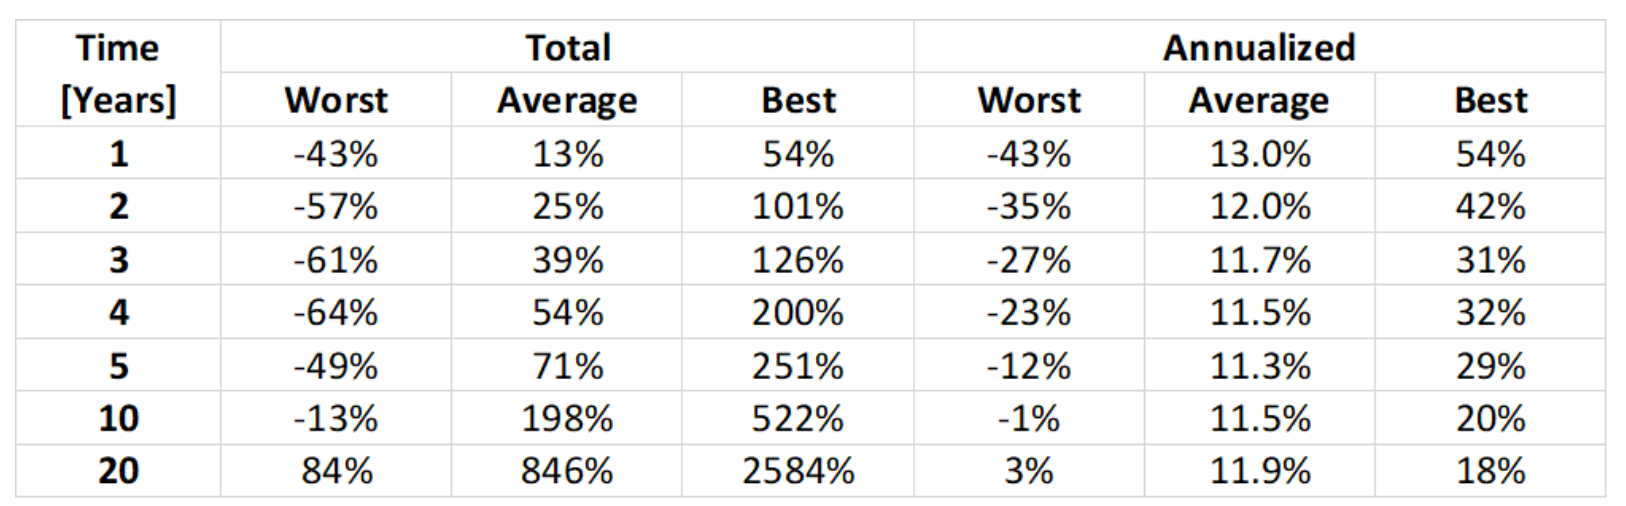
Worst, average, and best returns (total and annualized), for rolling periods between 1926 and 2018
Inflation Becomes a Real Problem in the Long Term
The problem with the above data is that they don’t take into account that over time, the dollar’s purchasing power tends to go down as a result of inflation. From 1926 to 2018, the dollar lost value in 7 out of every 8 years. As you look at longer periods, that fraction goes up to 100% of rolling 20-year periods.
Cash losing value is MORE frequent for longer periods
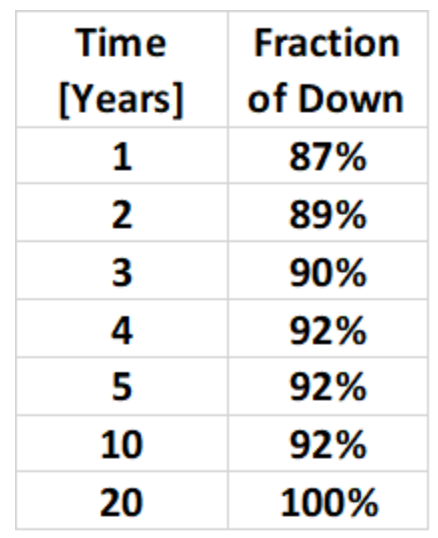
The fraction of rolling periods between 1926 and 2018 where the dollar lost purchasing power
Especially if you’ve been paying attention to how tame inflation has been recently, you’d be forgiven for thinking inflation isn’t a big concern anymore in absolute terms. However, looking at the long term, it’s still a major factor.
Over the long term, inflation eats away at your money’s purchasing power for all long-enough periods of time, with a whopping 52.8% loss for the average 20-year period.
In fact, holding cash would have lost you an annualized average of 3–4% for all holding periods, with total losses growing from 3.7% for the average single year to a whopping 52.8% for the average 20-year period. That means you’d be able to buy less than half as much after holding cash for the average 20-year period! Know what the worst period for cash was like? If you had held cash from 1966 to 1985, you’d have lost more than 2/3 of its value!
Even with low average inflation, loss of purchasing power becomes significant over long enough periods
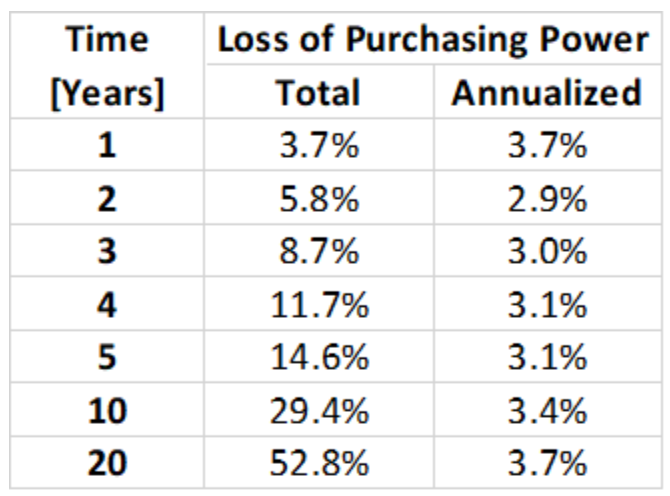
The average loss of purchasing power of cash (total and annualized) over rolling periods between 1926 and 2018
Comparing Stock Investment Risk to the Risk of Holding Cash
To figure out what stock market returns really mean for you, you have to adjust returns for inflation. Doing that, we see that the worst one-year loss was 39%, For 20-year periods, the worst-case total was a gain of 22%. For annualized returns, each time you look at a longer period, the worst case and best case also get closer to each other. Whereas the difference for a single year is 101% (between 62% gain and 39% loss), for 5-year periods that range drops to 35%, and for 20-year periods, the range narrows to 12%.
Even considering the Great Depression and Great Recession, the worst 20-year market performance was a total gain of 22%
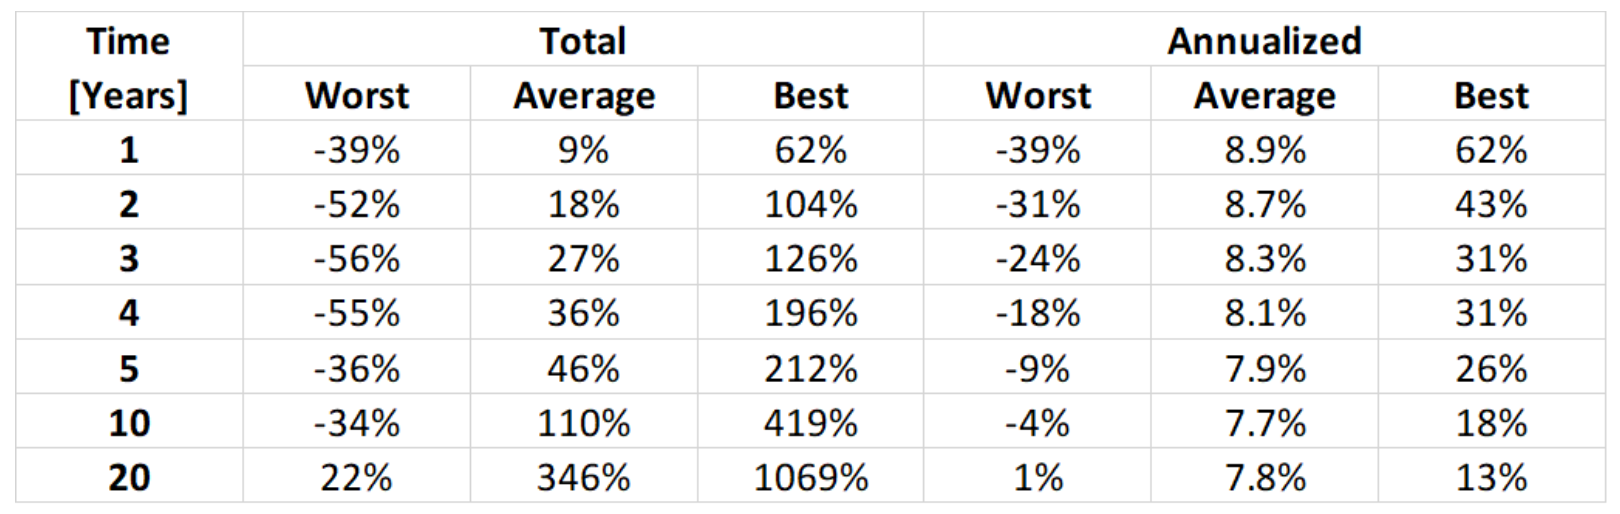
Worst, average, and best returns (total and annualized), accounting for inflation, for rolling periods between 1926 and 2018
Looking at how frequently the stock market loses purchasing power, we see losses about 1/3 of single years, 1/4 for rolling 5-year periods, 1/8 for 10-year periods, and not a single losing 20-year period.
Stock market losses are less frequent for longer investment periods even after adjusting for inflation
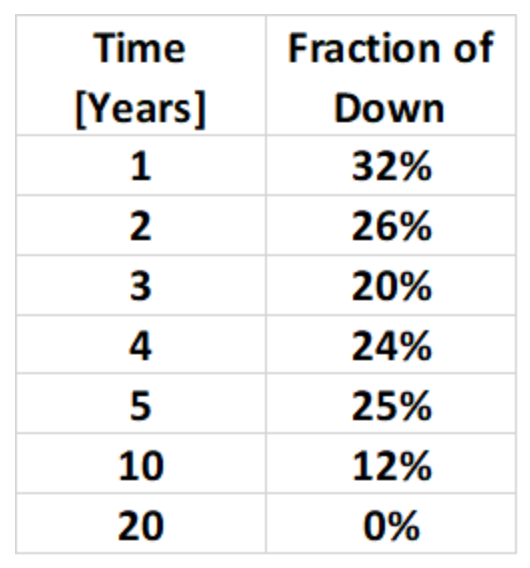
Fraction of rolling periods with inflation-adjusted stock market losses between 1926 and 2018
While these results are less inspiring than the pre-inflation returns, we have one last step to take, comparing them to the risk of holding cash.
Comparing how bad worst-case inflation-adjusted losses were for stocks vs. cash, we see the loss was about 3x worse for stocks compared to cash for single years, 2.5x worse for 2-year periods, 2x worse for 3-year periods, and 1.7x worse for 4-year periods.
For 5-year periods, the worst-case inflation-adjusted loss was comparable for stocks and cash.
For 10-year periods, cash lost about 1.7x more than stocks in the worst case!
Once you hit 20-year periods, worst-case inflation-adjusted stock market returns were 22% up, compared to 72% down for cash!!!
The worst-case market performance for 10- and 20-year periods were better than the worst case of holding cash for comparable periods
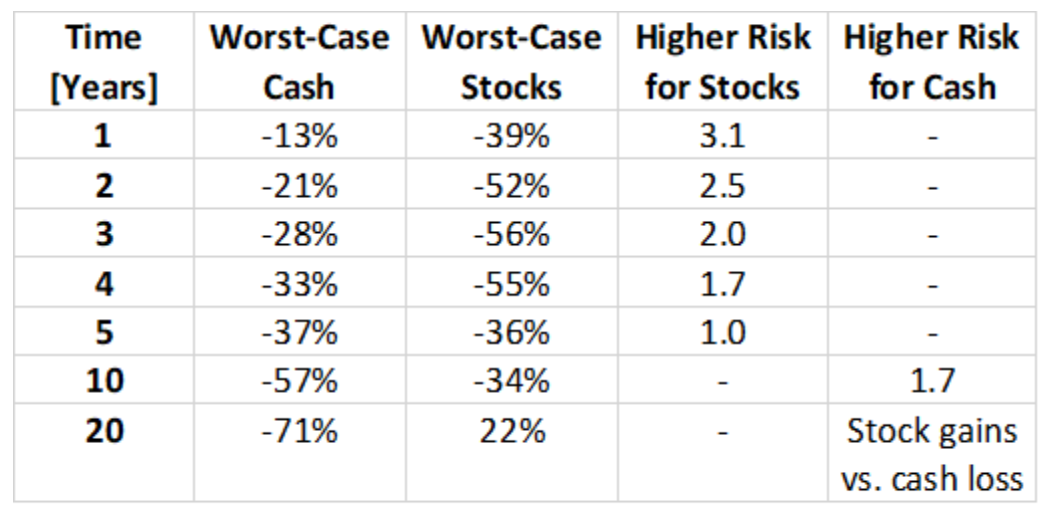
Comparing worst-case, inflation-adjusted loss of cash vs. stocks for rolling periods between 1926 and 2018
The Bottom Line on Stock Market Risk
Considering that the upside is far greater for stocks than for cash, it’s clear that for time horizons longer than a few years, investing in stocks is the winner compared to holding cash.
For 5-year periods, the worst-case inflation-adjusted loss was comparable for stocks and cash. For 10-year periods, cash lost about 1.7x more than stocks in the worst case! Once you hit 20-year periods, worst-case inflation-adjusted stock market returns were 22% up, compared to 72% down for cash!!!
Disclaimer: This article is intended for informational purposes only, and should not be considered financial advice. Before making major financial decisions, please speak with us or another qualified professional for guidance. The original version of this article first appeared on Wealthtender written by Opher Ganel.
About the Author Doug Finley
Douglas Finley, MS, CFP, AEP, CDFA founded Finley Wealth Advisors in February of 2006, as a Fiduciary Fee-Only Registered Investment Advisor, with the goal of creating a firm that eliminated the conflicts of interest inherent in the financial planner – advisor/client relationship. The firm specializes in wealth management for the middle-class millionaire.
Related Posts
Bringing Order to Your Investment Universe Part 1: The Beauty of Being Organized
The Next BlackBerry?
The Power of the Market, the Ultimate AI
The Cost of Trying to Time the Market
Market Behavior and the Weather
Financial Goals: Your Tickets To Ride
Looking for the Next Nvidia May Shrink Your Return
What’s Baked into Your Credit Exposure?
Session expired
Please log in again. The login page will open in a new tab. After logging in you can close it and return to this page.