
Two Steps Forward, One Step Back for Investors
Consider everything investors have been through in recent years: a global pandemic, rapid inflation, war in Europe, and volatile stock and bond markets. It’s reasonable to feel uneasy in the face of so much uncertainty. Now imagine it’s the end of 2019 and you know what you know now. You’re asked to predict market returns over the next three years. Will stocks be up 25%? Flat? Down 25%?
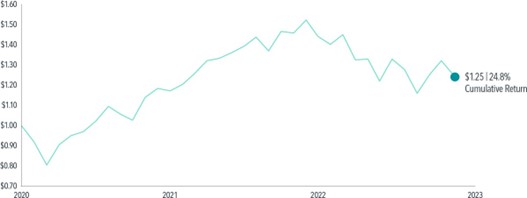
As you can see in Exhibit 1, the market was up almost 25% from 2020 through 2022.1 That includes last year’s 19% decline. Too often, people look only at year-by-year returns and don’t look at the total history of returns, which can be very informative.
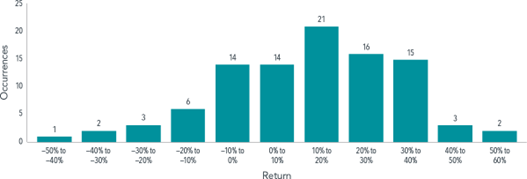
We now have 97 years of research-quality data on stock returns. Exhibit 2 shows the distribution of annual returns over that time period, ranging from a year when the market lost almost 50% to two years when it gained more than 50%. The bulk of the returns are between –10% and +40%. When you look at a histogram like this, you get a sense of the distribution of returns, rather than a forecast of what any year’s return will be. The best prediction of what will happen next year is a random draw from one of these 97 years.
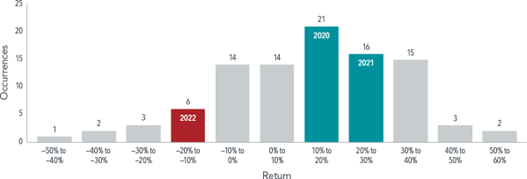
Let’s look more closely at the past three years. In Exhibit 3, the returns from 2020 and 2021 were positive, with 2022 negative. These three years to me seem representative of the history of stock returns: two steps forward and one step back. Two positive years and one negative. That’s about the way the world works.
But how do we explain the stock returns of these last three years, given the stress that people have felt with the pandemic? I think of it in terms of ingenuity and flexibility bailing us out. What happens when companies or individuals get hit with bad news? We don’t just sit there and take it—we try to figure out how to get back on track. That’s what happened here. The pandemic hit and markets dropped 20%.2 Then human ingenuity kicked in by the end of the year. We had a vaccine and started distributing it at incredible speed. That innovation continued as businesses adjusted into the next year.
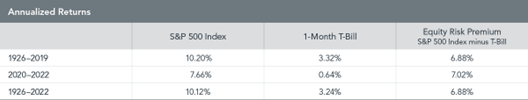
Let’s look at how the last three years compare with the previous 94. Exhibit 4 shows the returns on the S&P 500 index and US Treasury bills over the last 97 years. The first row is the 94-year time period of 1926–2019. The S&P 500 index compounded at 10.2% per year. Treasury bills, which we think of as being the riskless asset, compounded at 3.32%.3 We think of the difference between 10.2 and 3.32, which is 6.88 percentage points, as the reward for taking the stock market risk. So that’s the equity risk premium, almost 7% a year.
The next row shows the last three years. The S&P 500 compounded at 7.66%. Treasury bills were basically flat (0.64%).The difference between those two is also about 7%—7.02 percentage points. So, for the last three years, the risk premium of 7% a year is almost precisely what it had been the previous 94, about 7% a year.
In other words, the last three years in terms of equity returns have been “normal.”
What happens when companies or individuals get hit with bad news? We don’t just sit there and take it—we try to figure out how to get back on track.
How can we explain normal returns when it seemed to some people that the world was falling apart? Think of public financial markets as a giant information-processing machine. When bad news comes in, prices drop. When good news comes in, prices rise. The stock market every day is trying to set prices to induce investors to come in to invest. If the stock market had a negative expected outcome, nobody would invest. The stock market is constantly adjusting prices so that investors have a positive expected outcome.
One of the most important principles of investing is being a long-term investor with an investment plan you can stick with. The stock market will go up and down. It always has; it always will. If during this three-year period you felt like you had to bail out of stocks for some reason, then you had probably invested too much in stocks to begin with. But if you had about the right amount, for you, invested in stocks, there was a good chance that you didn’t have to make any adjustments to your portfolio mix.
What will happen over the next three years? Who knows? The good news is, if you’ve planned for the range of outcomes, you won’t have to worry about relying on a prediction.
FOOTNOTES
- In US dollars. S&P 500 Index annual returns 2020–2022. S&P data © 2023 S&P Dow Jones Indices LLC, a division of S&P Global. All rights reserved. Indices are not available for direct investment; therefore, their performance does not reflect the expenses associated with the management of an actual portfolio.
- S&P data © 2023 S&P Dow Jones Indices LLC, a division of S&P Global. All rights reserved.Indices are not available for direct investment. Index returns are not representative of actual portfolios and do not reflect costs and fees associated with an actual Decrease of 19.6% was from Jan. 1, 2020, to March 31, 2020.
- One-month Treasury bill data provided by
AUTHORS
David Booth
Executive Chairman and Founder
DISCLOSURES
The information in this document is provided in good faith without any warranty and is intended for the recipient’s background information only. “Dimensional” refers to the Dimensional separate but affiliated entities generally, rather than to one particular entity. Please click here to read the full text of the Dimensional Fund Advisor disclaimer.
About the Author Doug Finley
Douglas Finley, MS, CFP, AEP, CDFA founded Finley Wealth Advisors in February of 2006, as a Fiduciary Fee-Only Registered Investment Advisor, with the goal of creating a firm that eliminated the conflicts of interest inherent in the financial planner – advisor/client relationship. The firm specializes in wealth management for the middle-class millionaire.
Related Posts
What’s Baked into Your Credit Exposure?
Top 500 Stocks, Give or Take $2.1 Trillion
Japan in the News, But It’s Nothing New
Curve Your Enthusiasm with Fed Activity
Bringing Order to Your Investment Universe Part 2: Transitions and Taxes
Bringing Order to Your Investment Universe Part 1: The Beauty of Being Organized
Protecting Women’s Wealth
What I See When I Watch Basketball
Session expired
Please log in again. The login page will open in a new tab. After logging in you can close it and return to this page.