
- You are here:
- Home »
- Blog »
- Financial Education & News »
- Top Heavy Market? Giant Firms on Top Is Nothing New
Top Heavy Market? Giant Firms on Top Is Nothing New

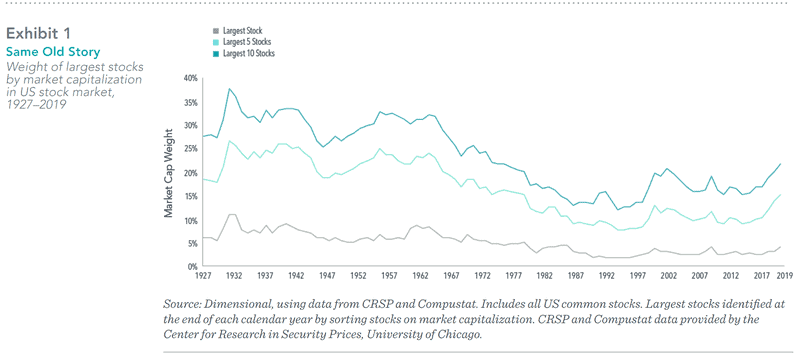
A top-heavy stock market with the largest 10 stocks accounting for over 20% of market capitalization and a marquee technology firm perched at No. 1? This sounds like a description of the current US stock market, dominated by Apple and the other FAANG stocks,(1) but it is actually a reference to 1967, when IBM represented a larger portion of the market than Apple at the end of 2019 (5.8% vs. 4.1%).
As we see in Exhibit 1, it is not particularly unusual for the market to be concentrated in a handful of stocks. The combined market capitalization weight of the 10 largest stocks, just over 20% at the end of last year, has been higher in the past.
A Top Heavy Market For A Long Time
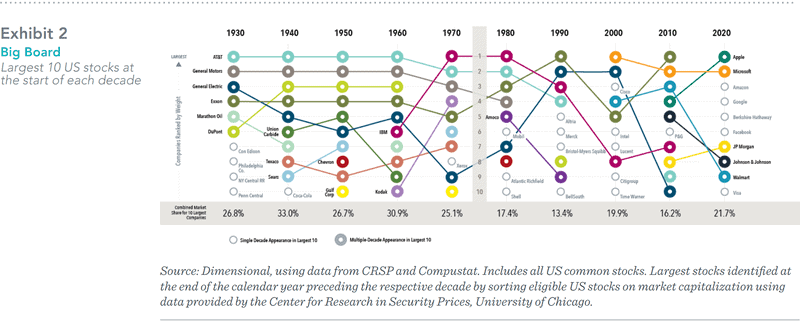
A breakdown of the largest US stocks by decade in Exhibit 2 shows some companies have stayed on top for a long time. AT&T was among the largest two for six straight decades beginning in 1930. General Motors and General Electric ranked in the top 10 at the start of multiple decades. IBM and Exxon were also mainstays in the second half of the 20th century. Hence, concentration of the stock market in a few large companies such as the FAANG stocks in recent years is not a new normal; it is old normal.
Technology Stocks Dominating
Moreover, while the definition of “high-tech” is constantly evolving, firms dominating the market have often been on the cutting edge of technology. AT&T offered the first mobile telephone service in 1946. General Motors pioneered such innovations as the electric car starter, airbags, and the automatic transmission. General Electric built upon the original Edison light bulb invention, contributing to further breakthroughs in lighting technology, such as the fluorescent bulb, halogen bulb, and the LED. So technological innovation dominating the stock market is not a new normal; it is an old normal too.
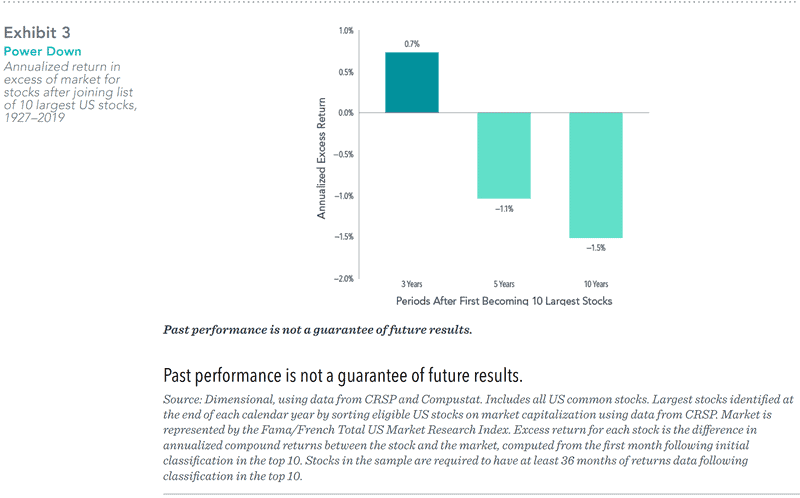
Another trend attributed to a new normal is the extraordinary performance of FAANG stocks over the past decade, leading some to wonder if we should expect these stocks to continue such strong performance going forward as contributors to a top heavy market. Investors should remember that any expectations about the future operational performance of a firm are already reflected in its current price. While positive developments for the company that exceed current expectations may lead to further appreciation of its stock price, those unexpected changes are not predictable.
To this point, charting the performance of stocks following the year they joined the list of the 10 largest firms shows decidedly less stratospheric results. On average, these stocks outperformed the market by an annualized 0.7% in the subsequent three-year period. Over five- and 10-year periods, these stocks underperformed the market on average.
The only constant is change, and the more things change the more they stay the same. This seems an apt description of the dominant stocks atop the market. While the types of businesses most prominent in the market vary through time, the fact that a small subset of companies’ stocks account for an outsized portion of the stock market is not new. And it remains impossible to systematically predict which large companies will outperform the stock market and which will underperform it. This underscores the importance of having a broadly diversified equity portfolio that provides exposure to a vast array of companies and sectors.
(1) Facebook, Amazon, Apple, Netfix, and Google (a subsidiary of Alphabet) are often referred to as the FAANG stocks.
GLOSSARY
Fama/French Total US Market Research Index: The value-weighed US market index is constructed every month, using all issues listed on the NYSE, AMEX, or Nasdaq with available outstanding shares and valid prices for that month and the month before. Exclusions: American depositary receipts. Sources: CRSP for value-weighted US market return. Rebalancing: Monthly. Dividends: Reinvested in the paying company until the portfolio is rebalanced.
DISCLAIMER
The information in this document is provided in good faith without any warranty and is intended for the recipient’s background information only. “Dimensional” refers to the Dimensional separate but affiliated entities generally, rather than to one particular entity. Please click here to read the full text of the Dimensional Fund Advisor Disclaimer.
About the Author Doug Finley
Douglas Finley, MS, CFP, AEP, CDFA founded Finley Wealth Advisors in February of 2006, as a Fiduciary Fee-Only Registered Investment Advisor, with the goal of creating a firm that eliminated the conflicts of interest inherent in the financial planner – advisor/client relationship. The firm specializes in wealth management for the middle-class millionaire.
Related Posts
Curve Your Enthusiasm with Fed Activity
Bringing Order to Your Investment Universe Part 2: Transitions and Taxes
Bringing Order to Your Investment Universe Part 1: The Beauty of Being Organized
Protecting Women’s Wealth
What I See When I Watch Basketball
Encouraging Data from Value’s Past and Present
Cost of Capital: A Gut Check on High-Flying Stock Returns
David Booth on Pursuing a Better Investment Experience
Session expired
Please log in again. The login page will open in a new tab. After logging in you can close it and return to this page.