
- You are here:
- Home »
- Blog »
- Investment Advice »
- How Has Market Behavior Evolved For Emerging Markets Investing?
How Has Market Behavior Evolved For Emerging Markets Investing?

Understanding market behavior and evolution are just as important for emerging markets as for developed markets, as emerging markets are an important part of a well-diversified global equity portfolio. However recent history reminds us that they can be volatile and can perform differently than developed markets. In this article, we provide a longer historical perspective on the performance of emerging markets and the countries that constitute them. We also describe the emerging markets opportunity set – the market behavior and how it has evolved in recent years.
Recent Performance in Perspective
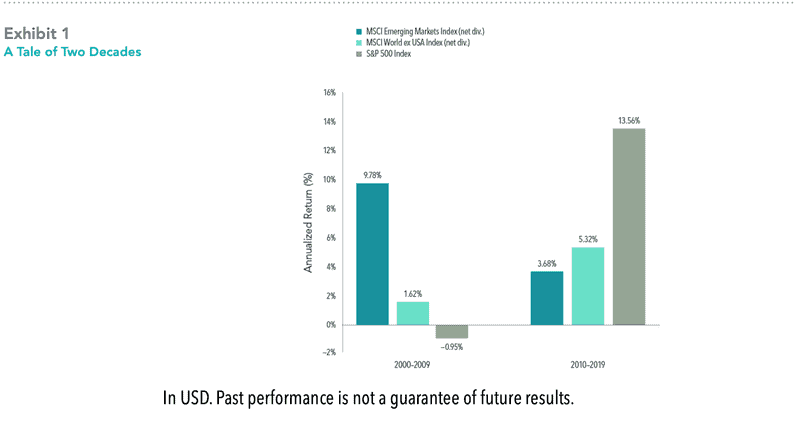
In recent years, the returns of emerging markets have lagged behind those of developed markets. As shown in Exhibit 1, over the past 10 years (2010–2019) the MSCI Emerging Markets Index (net div.) had an annualized compound return of 3.7%, compared to 5.3% for the MSCI World ex USA Index (net div.) and 13.6% for the S&P 500 Index. While recent returns have been disappointing, it is not uncommon to see extended periods when market behavior varies: emerging markets perform differently than developed markets. For example, just looking back to the prior decade (2000–2009), emerging markets strongly outperformed developed markets, with the MSCI Emerging Markets Index (net div.) posting an annualized compound return of 9.8%, compared to 1.6% for the MSCI World ex USA Index and –0.95% for the S&P 500 Index.
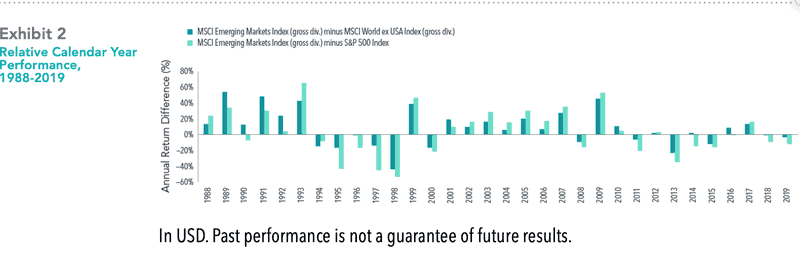
The magnitude of the return differences from year to year can be large. For example, relative to the US, the biggest underperformance as shown in market behavior in the past 10 years was in 2013, when emerging markets underperformed by over 34 percentage points. Exhibit 2 helps to put this difference into historical context: between 1988 and 2019, emerging markets outperformed US stocks by 34 percentage points or more per year four times (1993, 1999, 2007, and 2009) and underperformed US stocks by that same magnitude four times (1995, 1997, 1998, and 2013)
Over the entire period from 1988 to 2019, investors with a consistent allocation to emerging markets were rewarded. The MSCI Emerging Markets Index (gross div.) had an annualized return of 10.7% over this period. That exceeded the 5.9% annualized return for the MSCI World ex USA Index (gross div.) and was similar to the 10.8% average annualized return for the S&P 500, even when including the recent decade of strong performance of the US equity market. However, emerging markets returns were also more volatile. Looking at the same indices, the annualized standard deviation was higher for emerging markets: 22.4% vs. 14.1% for the US and 16.4% for developed markets outside the US.
This higher volatility, as well as the potentially sizable performance deviation from developed markets, underscores the importance of patience, discipline, and an appropriate allocation that investors can stick with when considering investing in emerging markets.
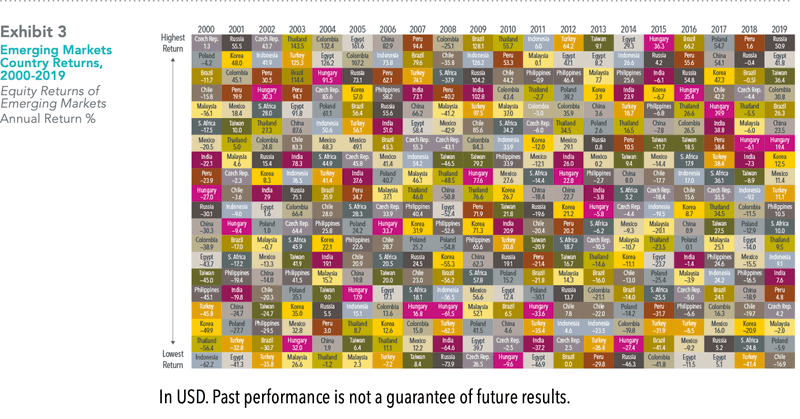
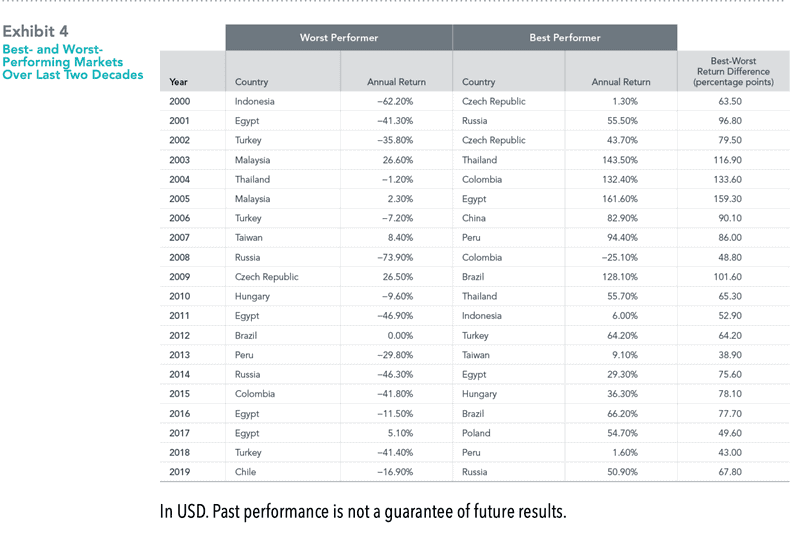
Focusing on the countries at the top and bottom of the columns for each year reveals substantial differences in returns between the best-performing and worst-performing market. Exhibit 4 shows that, over the past two decades, the annual return difference between the best- and worst-performing emerging markets has ranged from 39 percentage points in 2013 to 159 percentage points in 2005. On average, that difference has been approximately 80 percentage points per year. Perhaps somewhat counterintuitively, the extreme performers were not necessarily dominated by a handful of countries or by the smaller countries. In fact, 13 different countries were the worst annual performers, and similarly, 13 different countries were the best annual performers. These data illustrate the extreme outcomes that investors may be exposed to by concentrating in a few countries. There is no compelling evidence that investors can reliably add value through dynamic country allocation.[1] In consideration of this market behavior, by holding a broadly diversified portfolio, investors are instead well positioned to capture returns wherever they occur.
The Evolving Emerging Markets Opportunities Set
As a group, emerging markets represent a meaningful opportunity set for investors. The size and composition of the investible universe of emerging markets have steadily evolved since the late 1980s, when most comprehensive data sets and benchmarks for emerging markets begin. Over the years, major geopolitical, economic, and demographic changes have contributed to shifting weights for individual countries and companies within emerging markets, but in aggregate they have continued to grow.
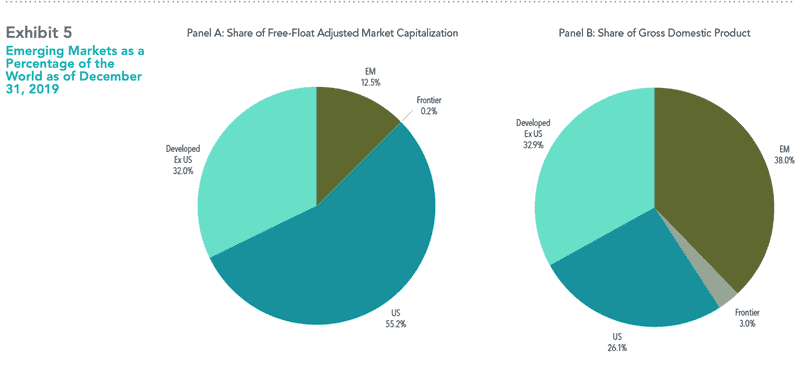
As of the end of 2019, the total free-float adjusted market capitalization of Dimensional’s emerging markets universe was $7.8 trillion and included 24 countries and over 7,000 securities. As shown in Panel A of Exhibit 5, emerging markets represented 12.5% of global markets’ free-float adjusted market capitalization. Measured by gross domestic product (GDP), emerging markets’ share increases to 38.0% (Panel B), reflecting the fact that emerging markets typically have smaller market capitalizations compared to GDP than most developed markets. Regardless of the metric, emerging markets represent a significant component of global markets.
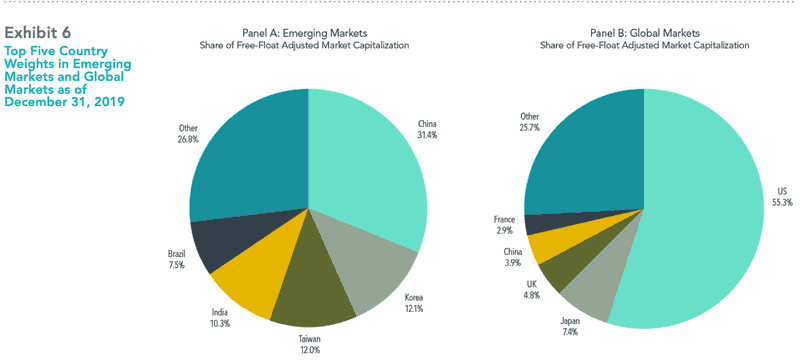
Panel A of Exhibit 6 examines the country composition of Dimensional’s emerging markets universe. The top five countries in terms of market capitalization—Brazil, China, India, Korea, and Taiwan—represented 73.2% at the end of 2019, slightly higher than at the beginning of the decade, when these same five countries represented 68.8% of the universe. A more significant development over the past decade has been the rise in the weight of China, from 17.2% of the universe at the end of 2009 to 31.4% at the end of 2019. This increase has been driven primarily by new equity issuance and new avenues for foreign investors to gain exposure to Chinese companies, including securities listed on the local Shanghai and Shenzhen stock exchanges through Hong Kong stock connect programs.
The growing size of China in the emerging markets has prompted many questions from investors on issues such as benchmarking and concerns about potential concentration. While these issues are complex, it is often helpful to consider China’s weight from a global perspective. Panel B of Exhibit 6 shows the weights of the top five countries in the global universe as of the same date. Compared to its 31.4% weight in the emerging markets universe, China’s weight was 3.9% in the global market, making it the fourth- largest country after the US, Japan, and the UK.
In addition to changes in size and country composition, emerging markets have undergone important improvements in their market mechanisms and microstructures over the past decade. Generally, emerging markets have become more open to foreign investors with fewer constraints on capital mobility. Evidence of these developments includes fewer instances of market closings, capital lockups, and trading suspensions of individual stocks in many markets. Finally, emerging markets have broadly adopted international accounting and reporting practices over the last decade. Our analysis suggests more than 90% of the firms in most emerging markets now report their annual financial statements according to International Financial Reporting Standards (IFRS) or US Generally Accepted Accounting Practices (GAAP). In countries like China, India, and Taiwan, the national standards have substantially converged with IFRS. This has helped improve the reliability and transparency of financial data in emerging markets.
Emerging Market Behavior in Summary
In sum, emerging markets represent a meaningful opportunity set within global markets. They continue to evolve in their structures, market mechanisms, and accessibility. Investors in emerging markets can benefit from a long-term perspective, expertise and flexibility in navigating these changing markets, and an approach that emphasizes diversification and discipline.
1. James L. Davis, “Mean Reversion in the Dimensions of Expected Stock Returns” (white paper, Dimensional Fund Advisors, 2014).
Authors
Karen Umland
Senior Investment Director and Vice President, Dimensional Fund Advisors
Ethan Wren
Senior Portfolio Manager and Vice President, Dimensional Fund Advisors
Disclaimer
The information in this document is provided in good faith without any warranty and is intended for the recipient’s background information only. “Dimensional” refers to the Dimensional separate but affiliated entities generally, rather than to one particular entity. Please click here to read the full text of the Dimensional Fund Advisor Disclaimer.
About the Author Doug Finley
Douglas Finley, MS, CFP, AEP, CDFA founded Finley Wealth Advisors in February of 2006, as a Fiduciary Fee-Only Registered Investment Advisor, with the goal of creating a firm that eliminated the conflicts of interest inherent in the financial planner – advisor/client relationship. The firm specializes in wealth management for the middle-class millionaire.
Related Posts
Market Behavior and the Weather
Why Stick with a Globally Diversified Portfolio? Principle 7 in Evidence-Based Investing
Diversify Your Investment Universe: Principle 6 in Evidence-Based Investing
The More Things Change
Strategic vs. Tactical Asset Allocation: Does It Matter?
Three Upside-Down Investment Insights
Playing the Prediction Game – Hindsight Is 20/20. Foresight Isn’t.
Why “Safe Harbors” Can Be Risky Business And How You Can Mitigate
Session expired
Please log in again. The login page will open in a new tab. After logging in you can close it and return to this page.